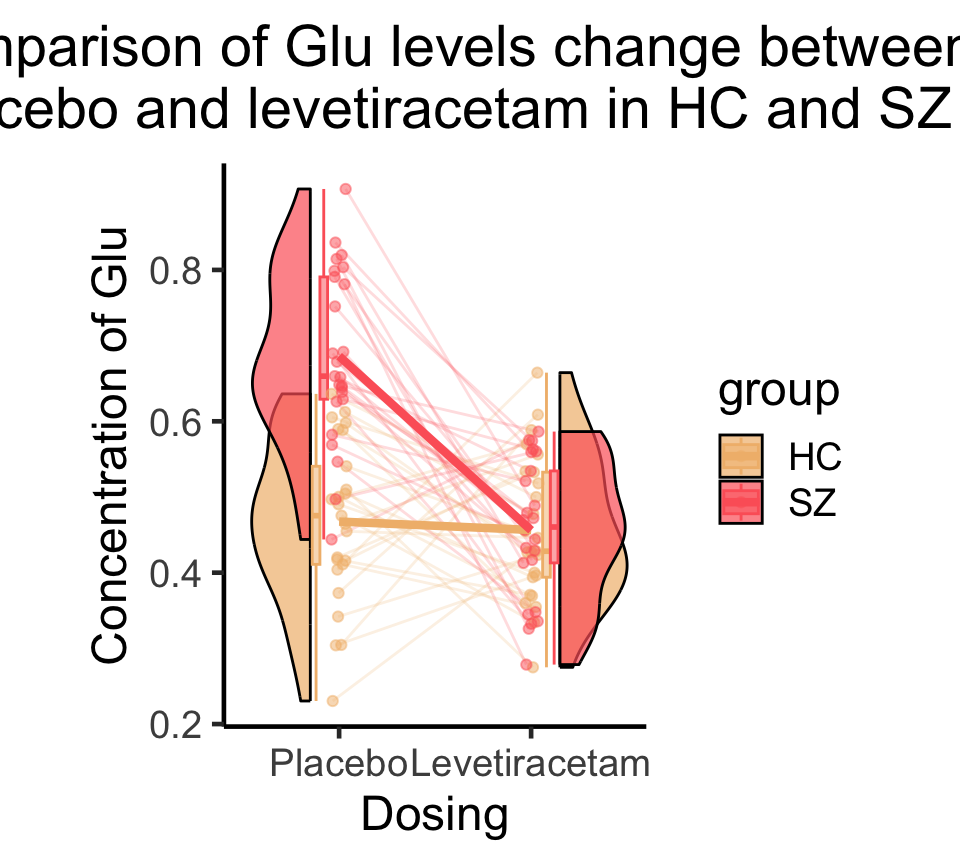
library (ggplot2)library (ggrain)library (wesanderson)<- c (rnorm (25 , mean= 0.45 , sd= 0.10 ), rnorm (25 , mean= 0.45 , sd= 0.09 ), rnorm (25 , mean= 0.69 , sd= 0.11 ), rnorm (25 , mean= 0.45 , sd= 0.11 ))<- c (replicate (50 , "HC" ), replicate (50 , "SZ" ))<- c (replicate (25 , "Placebo" ), replicate (25 , "Drug" ), replicate (25 , "Placebo" ), replicate (25 , "Drug" ))<- c (replicate (2 , 101 : 125 ), replicate (2 , 201 : 225 ))<- data.frame (id, group, dosing, glx)$ dosing <- factor (data$ dosing, levels = c ('Placebo' , 'Drug' ))$ group <- factor (data$ group, levels = c ('HC' , 'SZ' ))<- "Pastel1" <- wes_palette ("GrandBudapest1" , n= 2 , type = "discrete" )# wes_palette("GrandBudapest1", type = "discrete", n=2) # jpeg(file="files/rain_plot.jpeg", height = 5000, width = 3500, res=400) <- ggplot (data[data$ dosing %in% c ('Placebo' , 'Drug' ),], aes (dosing, glx, fill = group, color= group)) + geom_rain (alpha = .5 , rain.side = 'f2x2' , id.long.var = "id" ,violin.args = list (color = "black" , alpha = .7 )) + stat_summary (fun = mean, geom = "line" , aes (group = group, color = group), lwd= 1.5 ) + # stat_summary(fun = mean, geom = "point", aes(group = group, color = group)) + labs (title = "Comparison of Glu levels change between \n placebo and levetiracetam in HC and SZ" ,x = "Dosing" ,y = "Concentration of Glu" + scale_x_discrete (labels = c ('Placebo' ,'Levetiracetam' )) + theme_classic (base_size = 18 ) + theme (plot.title = element_text (hjust = 0.5 ), legend.position= "right" , aspect.ratio= 4 / 3 ) + scale_fill_manual (values = pal) + scale_color_manual (values = pal) + guides (fill = guide_legend ()) 
